Should I Be Buying Shares Right Now?
The recent global market meltdown was among one of the most vicious market drops in history, both by magnitude and velocity of the fall. India’s primary index, the Nifty 50 corrected ~40% from it’s January highs in just 25 trading sessions! However, the chart below shows that a strong correction had been due since September 2018, with a momentum divergence building up on the Monthly charts. That is not to say that this crash was entirely predictable, but being overly bullish before the crash would have been quite naive.
Here’s how the sectors performed over a year (as on May 29th

RETAILERS!
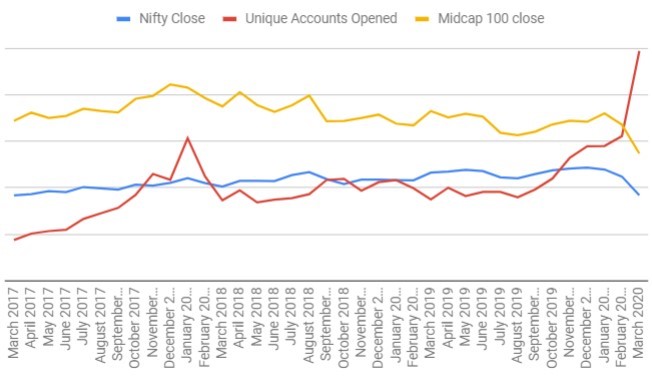
It is important to highlight that whenever there is a significant market correction, a lot of retail investors are tempted into entering, hoping for a recovery. This is shown by the following data, by Mr. Nithin Kamath, Founder CEO of Zerodha. It shows how “retail accounts opened” saw a massive surge at a time when the markets had started correcting in a very major way. It was a time when the NSEVIX was on the rise, well above its usual range of 10-25, and daily moves of 4-8% in Nifty were considered “normal”.

A lot of market experts often label this retail investor mentality as foolhardy, and claim that if retailers are getting in now, the worst is yet to come. However, this time around, the experts were not quite right.
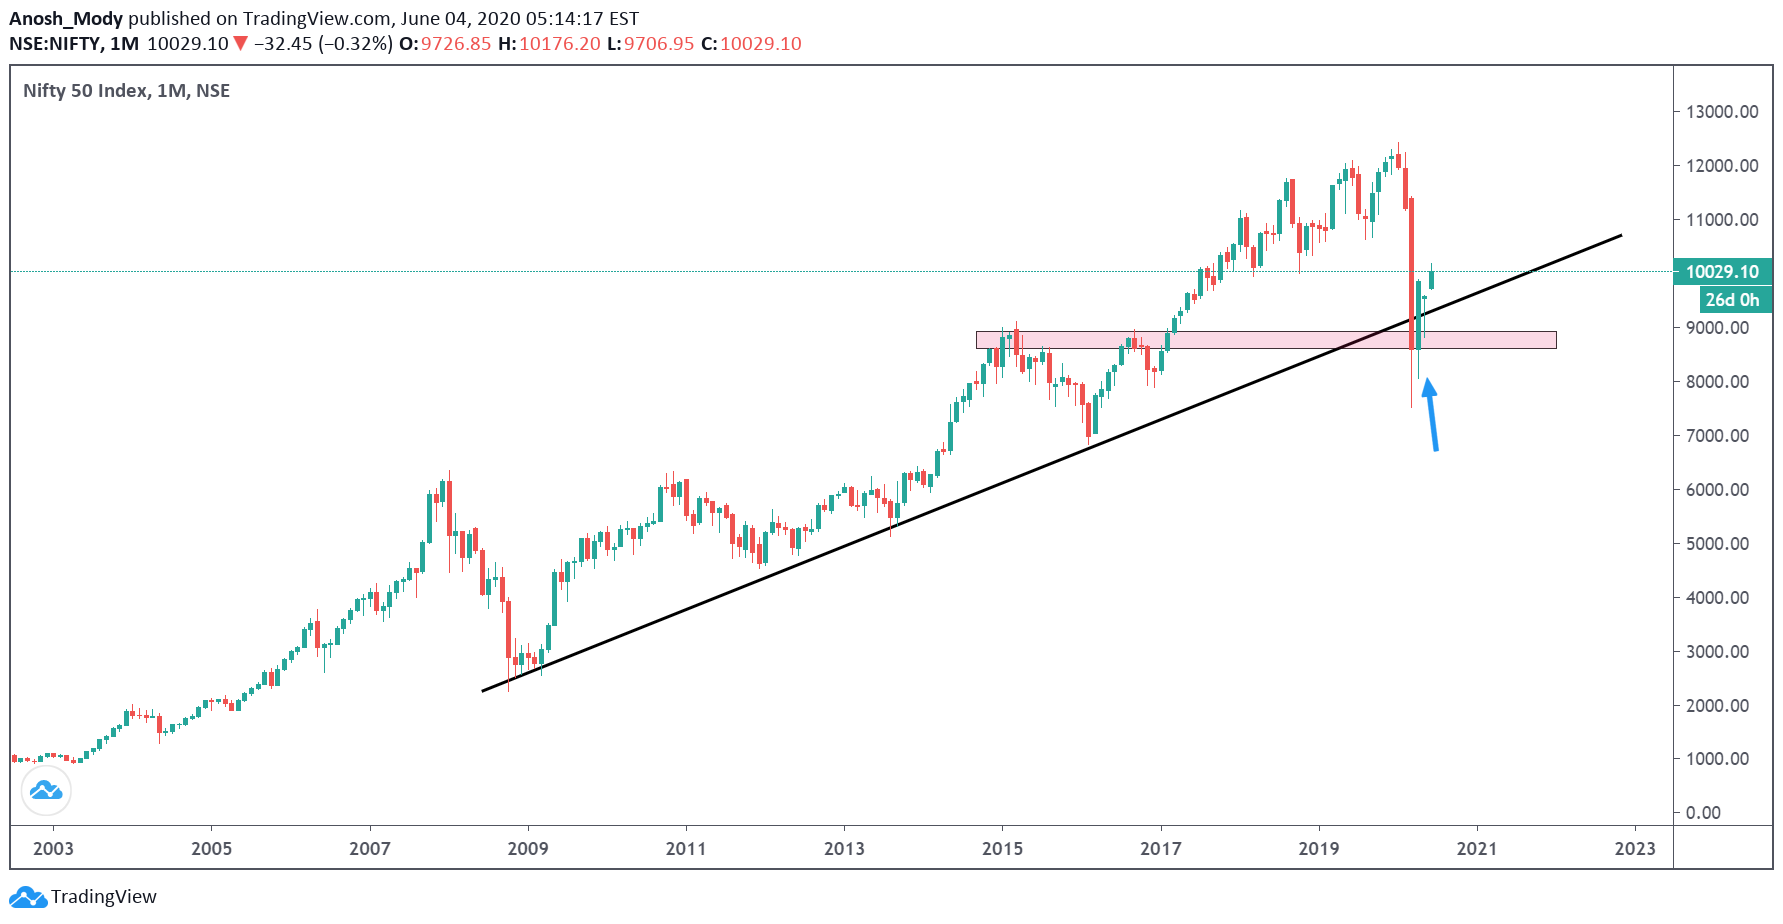
Nifty indeed did find a bottom in late March 2020, as seen in the following charts, one a simple trendline with horizontal demand zone and the other, Ichimoku (a Japanese trend following system).

The index did pierce the trendline, however it subsequently managed to close above it once again so it’s best to believe that the trendline is still valid.)

(The March and April candles have wicks below the kumo cloud, but neither breached the cloud on a monthly closing basis.)what is ichimoku https://www.investopedia.com/terms/i/ichimokuchart.asp
So, what now?!
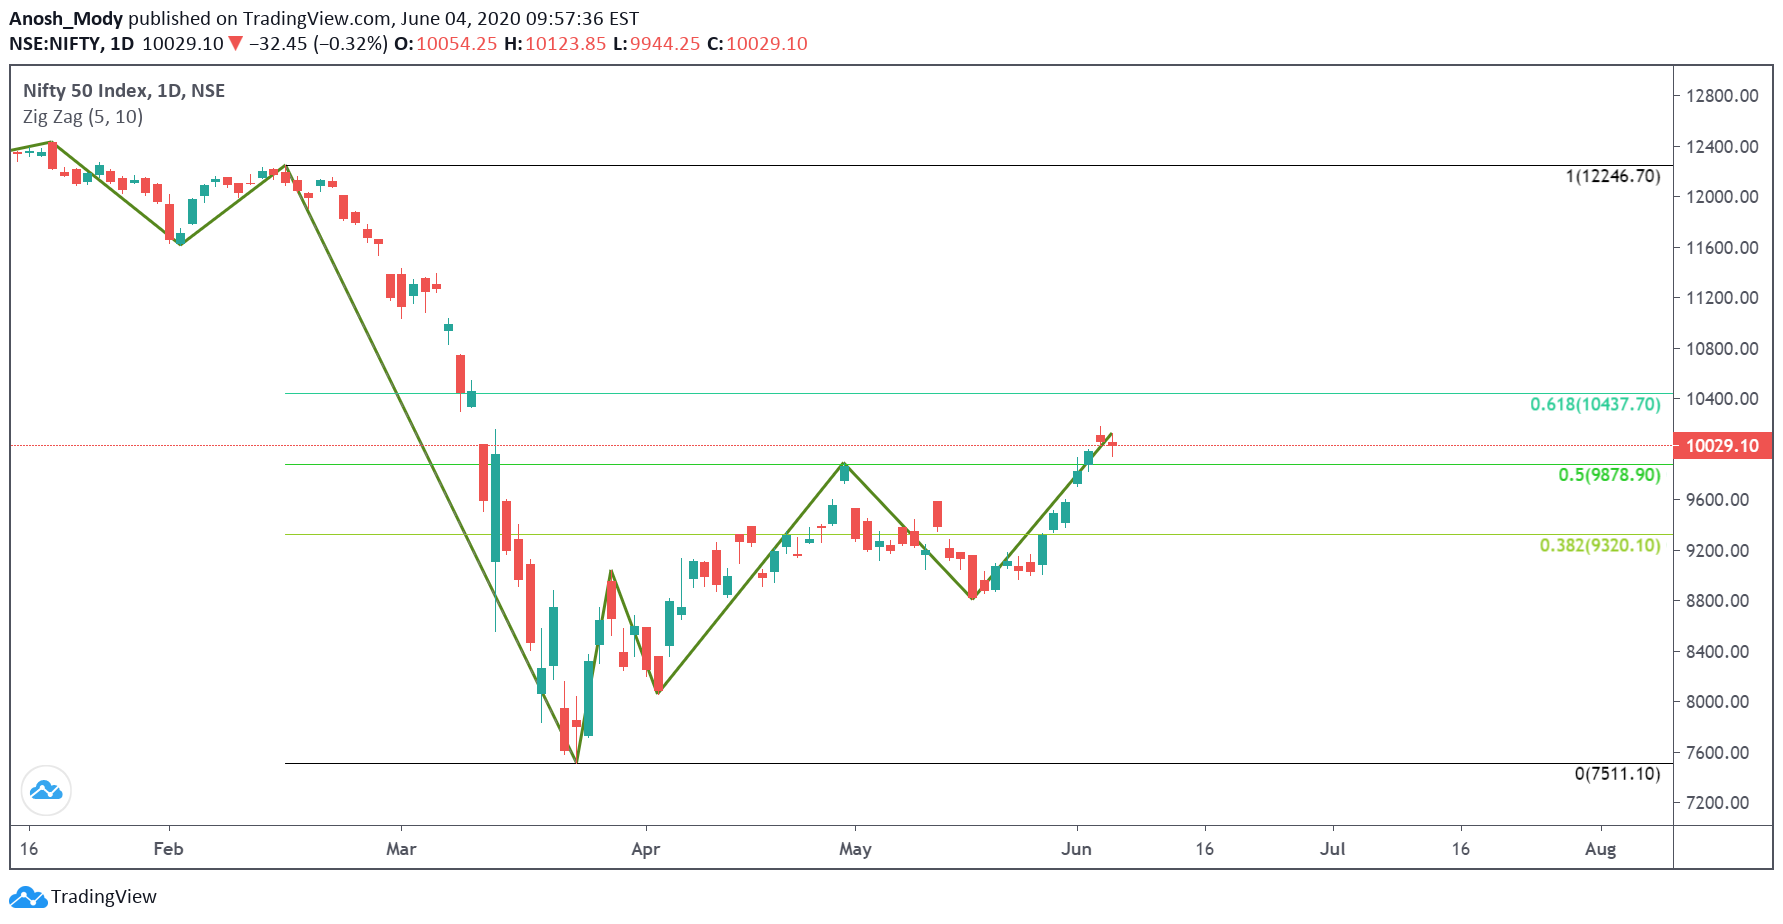
Is this bottom surely going to hold? Is the worst behind us? Should we be long or short nifty? Frankly, I don’t know. But looking at recent price action (chart below), where the price has crossed 2 important Fibonacci retracements, and the zig-zag indicator is making higher highs and higher lows, I am more inclined towards being cautiously bullish, than overly bearish.

This is not to say that I have ruled out the possibility of another vicious bear cycle, or a long-drawn time correction. As John M. Keynes wisely said, when the facts change, I change my mind. Hence, I shall be closely monitoring the markets and my positions for any drastic change in chart structure and direction.
Unsolicited (?) Advice (No.1): If your long-term holdings are currently deep in the red, now might not be the best time to panic sell. On the contrary, personal liquidity permitting, one can look to enter some fantastic businesses with solid long-term track records at mouth-watering valuations, in a staggered manner (not necessarily SIP), or lower average/pyramid on their existing quality holdings.
Unsolicited (?) Advice (No.2): If your profession/business/personal commitments hinder you from allocating time and effort (in addition to your hard-earned money) towards monitoring your investments, get in touch with a qualified professional to do it for you.
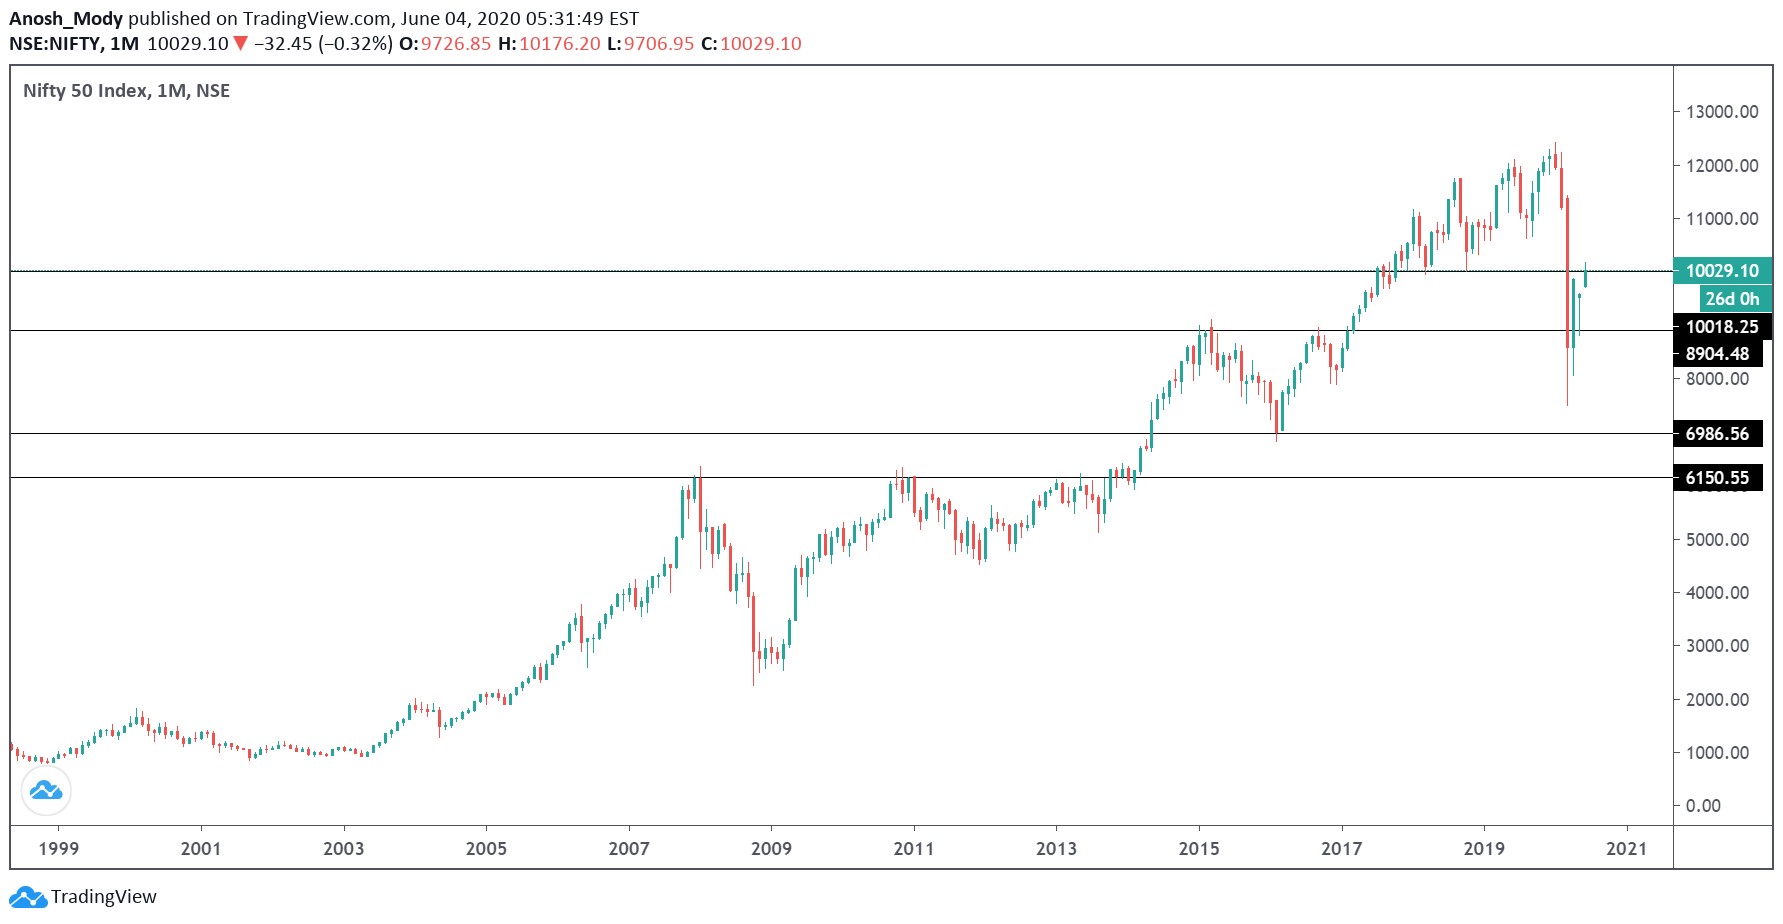
Bro tip; here are a few major levels to watch out for in case Nifty50 forgets to read this article and starts tanking again (marked in black lines), in addition to the long-term trendline and the Ichimoku levels in the charts above.
Yes, we are at one right now, as on 4th June 2020.

Happy Investing.
Disclaimer:
- I, Anosh Mody, shall take no responsibility for any losses occurring out of investment/trading decisions you make based off the contents of this article.
- This article is meant for educational purposes only, please consult your investment advisor before acting upon any information you see here.
- I have open positions, kindly assume that I am biased.

